Documentation
Signals
The org-wide tracking feed — every tracked request with its cost, revenue and margin, plus tools to record and generate usage.
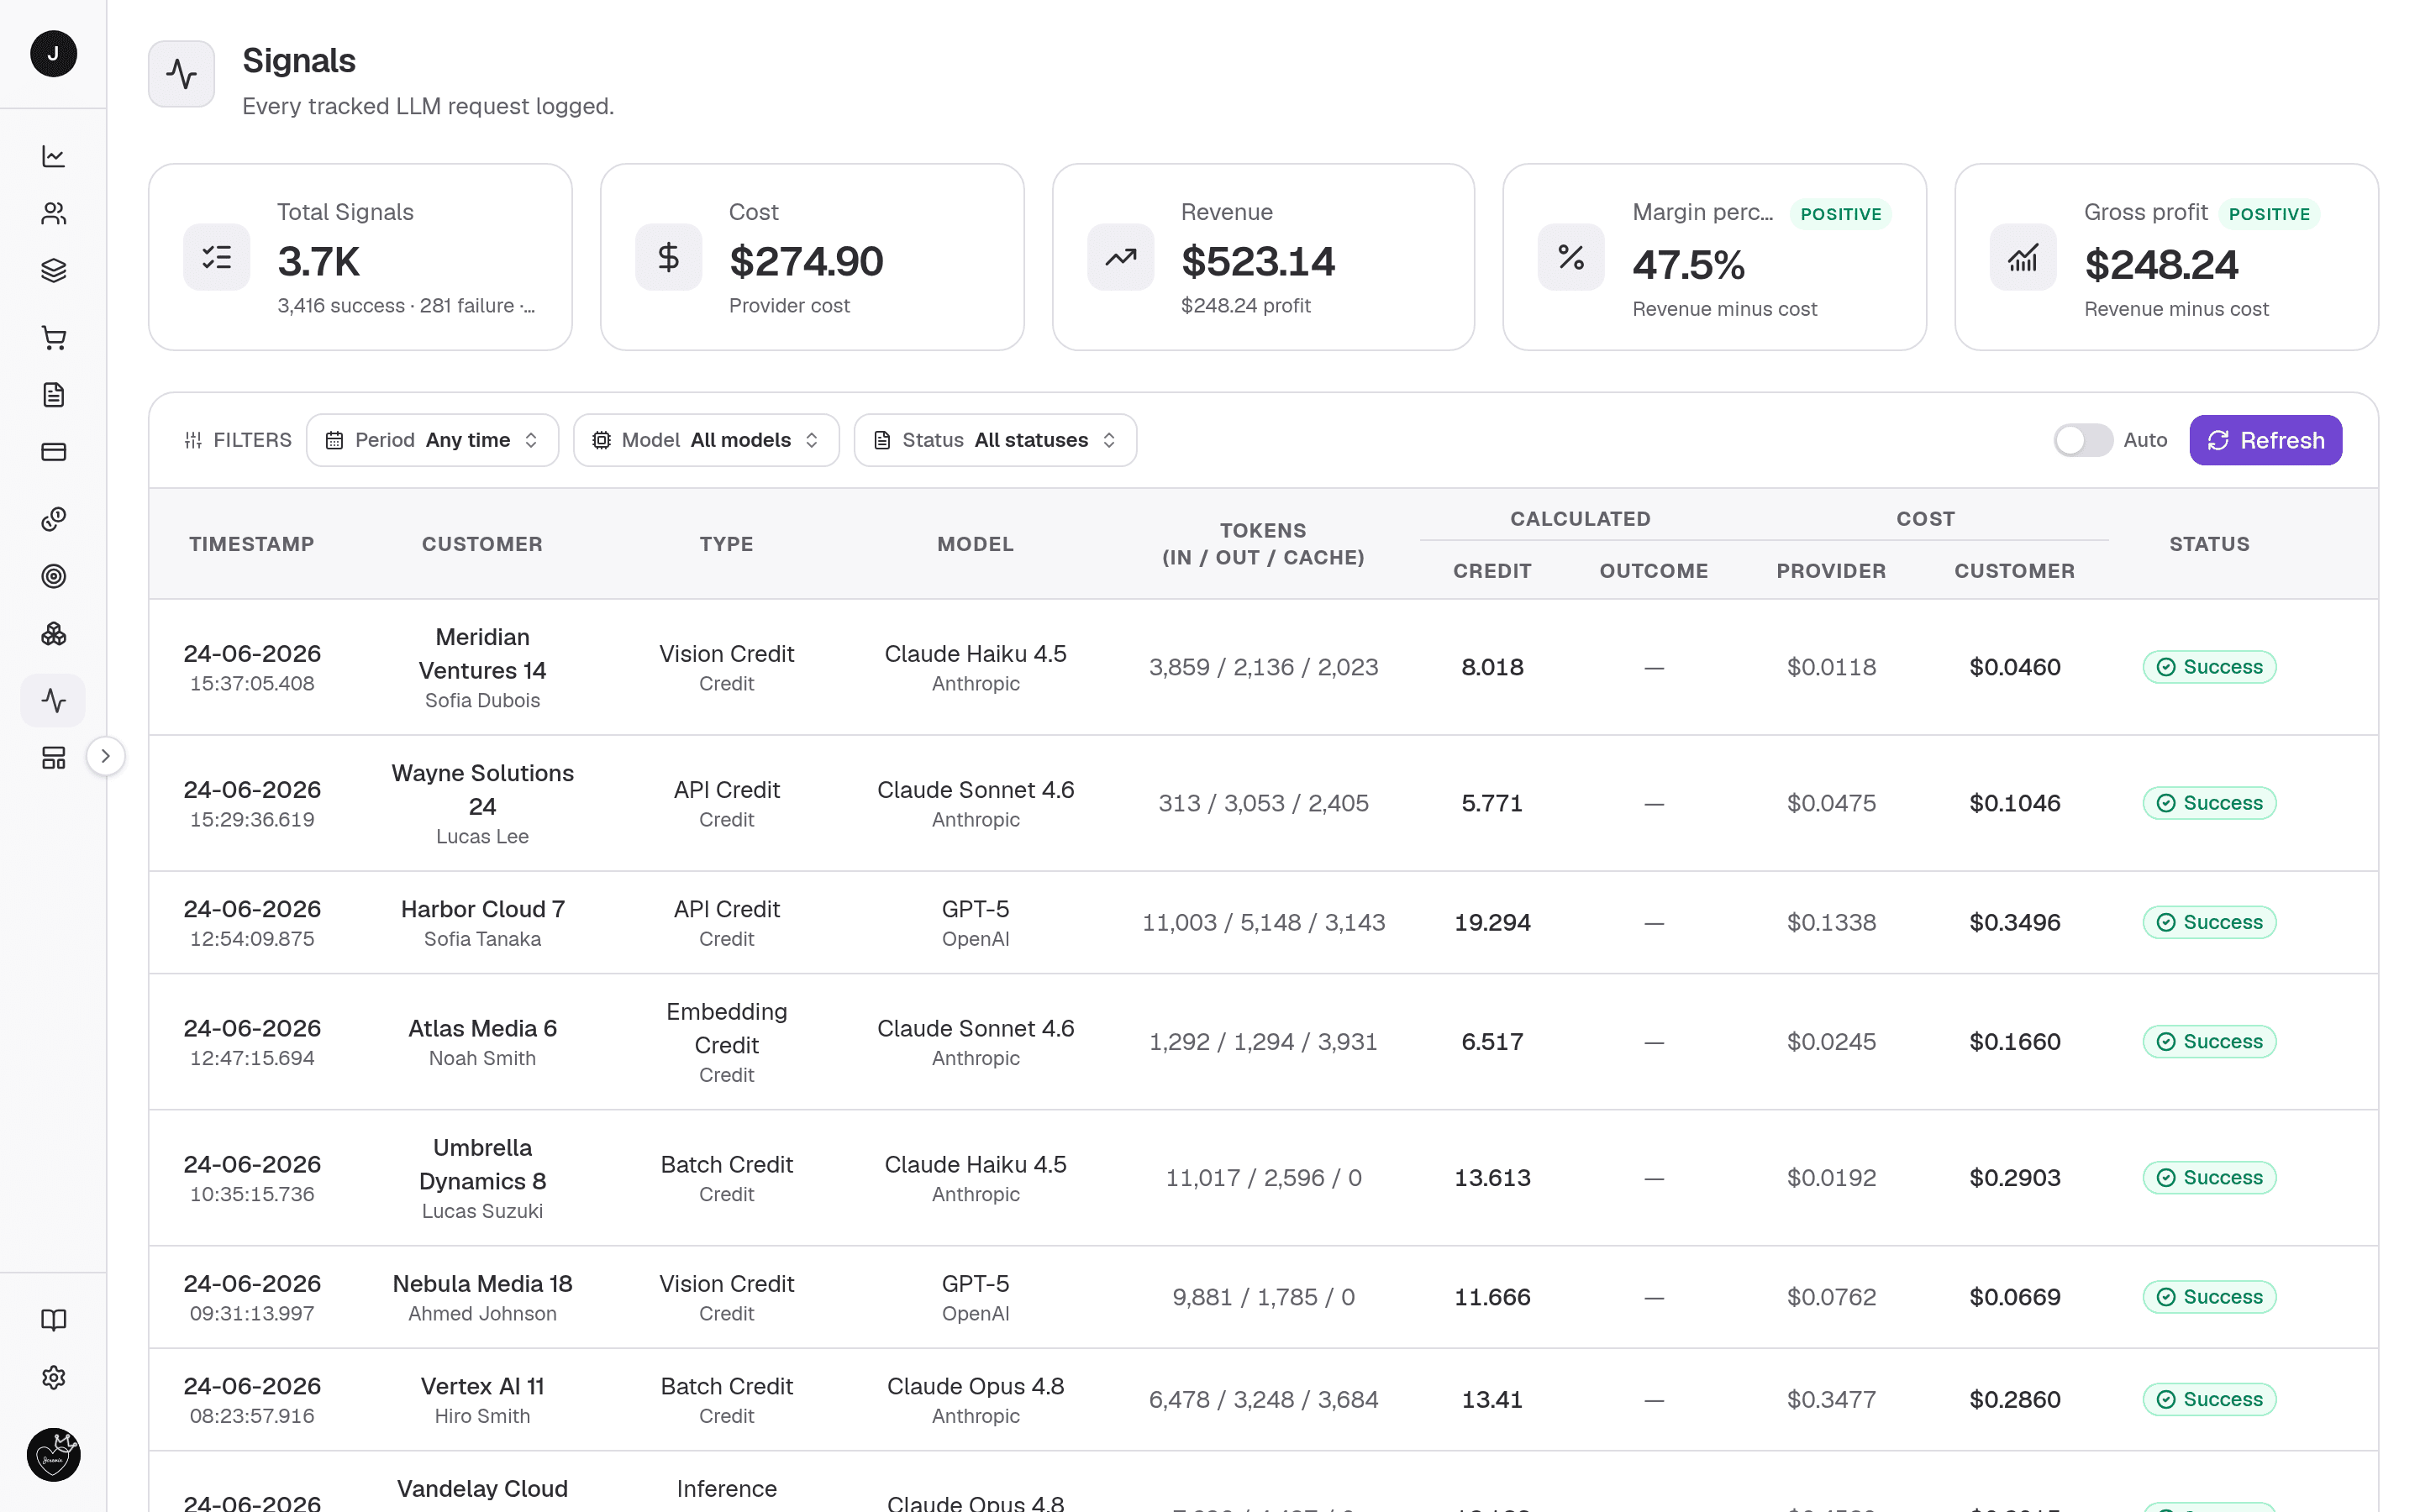
Signals is your Organisation's live tracking feed. Every tracked LLM request that flows through the usage pipeline lands here as a Signal — one usage log, priced against a Customer's Plan by Model and token counts, carrying both what it cost you and what you bill for it. The page rolls those logs into headline KPIs and lists them in an org-wide table, so finance and ops can watch usage, cost, and margin as traffic arrives.
What you can do here
- Read the headline KPIs — total Signals, cost, revenue, margin, and gross profit — for your active Organisation.
- Watch the org-wide usage feed, and search or filter it by Member, Model, and status.
- Toggle Auto to reload the feed every few seconds while traffic streams in, or hit Refresh for a one-off update.
- Record Signals programmatically through the Signals API — every recorded request streams straight into this feed. See Naming the Customer below.
- In a Sandbox workspace, Ingest Test Data to flood the feed with realistic dummy usage.
On this page
Stat cards
A five-card KPI strip sits above the feed. Every figure is scoped to the active Organisation and excludes Unit usage (Units have their own reporting flow).
| Card | What it shows |
|---|---|
| Total Signals | Count of recorded Signals. A hint breaks the lifecycle down: success · failure, plus processing, pending, and failed counts when any exist. |
| Cost | Total provider cost of the recorded Signals. |
| Revenue | Total customer cost — what you bill — with a profit hint. |
| Margin percentage | Revenue minus cost as a share of revenue, flagged with a Positive / Negative badge. |
| Gross profit | Revenue minus cost, flagged Positive / Negative. |
The lifecycle terms distinguish a Signal's business result from where it sits in the ingestion inbox:
- success / failure — the business outcome of a processed Signal.
- processing — an inbox row still in flight, not yet turned into a usage log and with no error recorded.
- pending — an inbox row that hit an issue and is awaiting a retry.
- failed — an inbox row an admin deliberately marked as terminal.
Only processed Signals count toward cost, revenue, and margin — unprocessed inbox rows never inflate the financial totals.
Usage feed
Below the KPIs is the org-wide usage table — every recorded Signal across the Organisation, newest first, paginated. Its columns cover Timestamp, Company (the Customer), Member, Model, Type (Wallet, Credit, or Outcome), Tokens (input / output / cache), Credit, Outcome, Cost, and Status.
Filter the feed with the search box and the Member, Model, and Status controls on the filter bar. Until any Customer's Members start consuming usage, the table shows an empty hint instead of rows.
Refresh controls
The refresh controls ride on the right of the filter bar. Auto is a switch — while it's on, the feed reloads on a short timer and the manual Refresh button is disabled. Turn Auto off to refresh only when you click.
What a Signal is
A Signal is exactly one usage log: a single tracked request recorded against a Customer's active Plan. It tracks exactly one of the types the Plan supports — Wallet, Credit, or Outcome — priced against a Model and its token counts, which produces the provider cost and the customer revenue you see in the KPIs. Units are not Signals; they are reported through their own flow and are kept out of both the stat cards and the feed.
Recording a Signal
Signals are recorded programmatically — your backend calls the Signals API as each tracked request finishes, and the result appears in this feed. There is no manual "create signal" button on the page today; recording happens over the wire.
What a recorded Signal carries
Each call records exactly one usage log, and the same fields drive the pricing whether it comes from the API, the SDK, or the Sandbox ingester:
- Customer (required) — the Customer to track. They must have an active Plan; without one, record a Purchase first.
- Usage type (required) — one of Wallet, Credit, or Outcome, limited to what the Customer's Plan actually tracks.
- Credit type — for a Credit Signal, pick the Credit. A Plan that tracks specific Credits offers only those; a pure Wallet Plan can bill any active Credit, priced to the Wallet.
- Outcome and Outcome step — for an Outcome Signal, pick the Outcome and the step to advance.
- Member (optional) — attribute the usage to a Member. A member-less Outcome call pools at the Customer level.
- Model (required) plus Input, Output, and Cache token counts — how the Signal is priced.
- Status — Success, Failure, or Pending.
Saving records the signal through the real usage pipeline; the KPIs and feed re-pull so it shows up without a full reload.
Generating test data
Ingest Test Data appears only in a Sandbox workspace, and only for an owner or admin. It opens a dialog where you choose how many dummy Signals to generate — 100, 200, 300, 400, or 500 — built from the Sandbox's seeded Customers, Plans, Credits, Outcomes, and Units. Each one is recorded through the real usage pipeline, so cost, revenue, and Credit totals update exactly as they would for live traffic — a fast way to populate a fresh workspace before a demo.
Naming the Customer
Every Signal says which Customer it belongs to. Send either our customerId or
your own externalId for the Customer (set on the Customer — see Your own customer ids). If a
Signal carries both, customerId wins and externalId is ignored.
Signals are processed in the background, so a Signal whose externalId matches
no Customer is still accepted, then shows here as pending with the reason
No customer with external id "…". Add the Customer (or set its External ID)
and retry it.
curl -X POST https://payments.clocknext.com/api/v1/signal/credit \
  -H "Authorization: Bearer $CLOCKNEXT_API_KEY" \
  -H "Content-Type: application/json" \
  -d '{
    "externalId": "acme-42",
    "agentKey": "deep-research",
    "usage": { "model": "openai/gpt-4o", "inputTokens": 1200, "outputTokens": 350 }
  }'
await cnk.signals.credit({
externalId: "acme-42",
agentKey: "deep-research",
model: "openai/gpt-4o",
tokens: { input: 1200, output: 350 },
});Related
- Record Signals — record credit / outcome / wallet / unit signals from your backend.
- List Customer Usage Log — read recorded usage over the API.
- Credits, Outcomes, and Units — the tracked components a Signal is priced against.