Documentation
Revenue dashboard
Track revenue, cost, margin, MRR/ARR, and new business across your workspace at a glance.
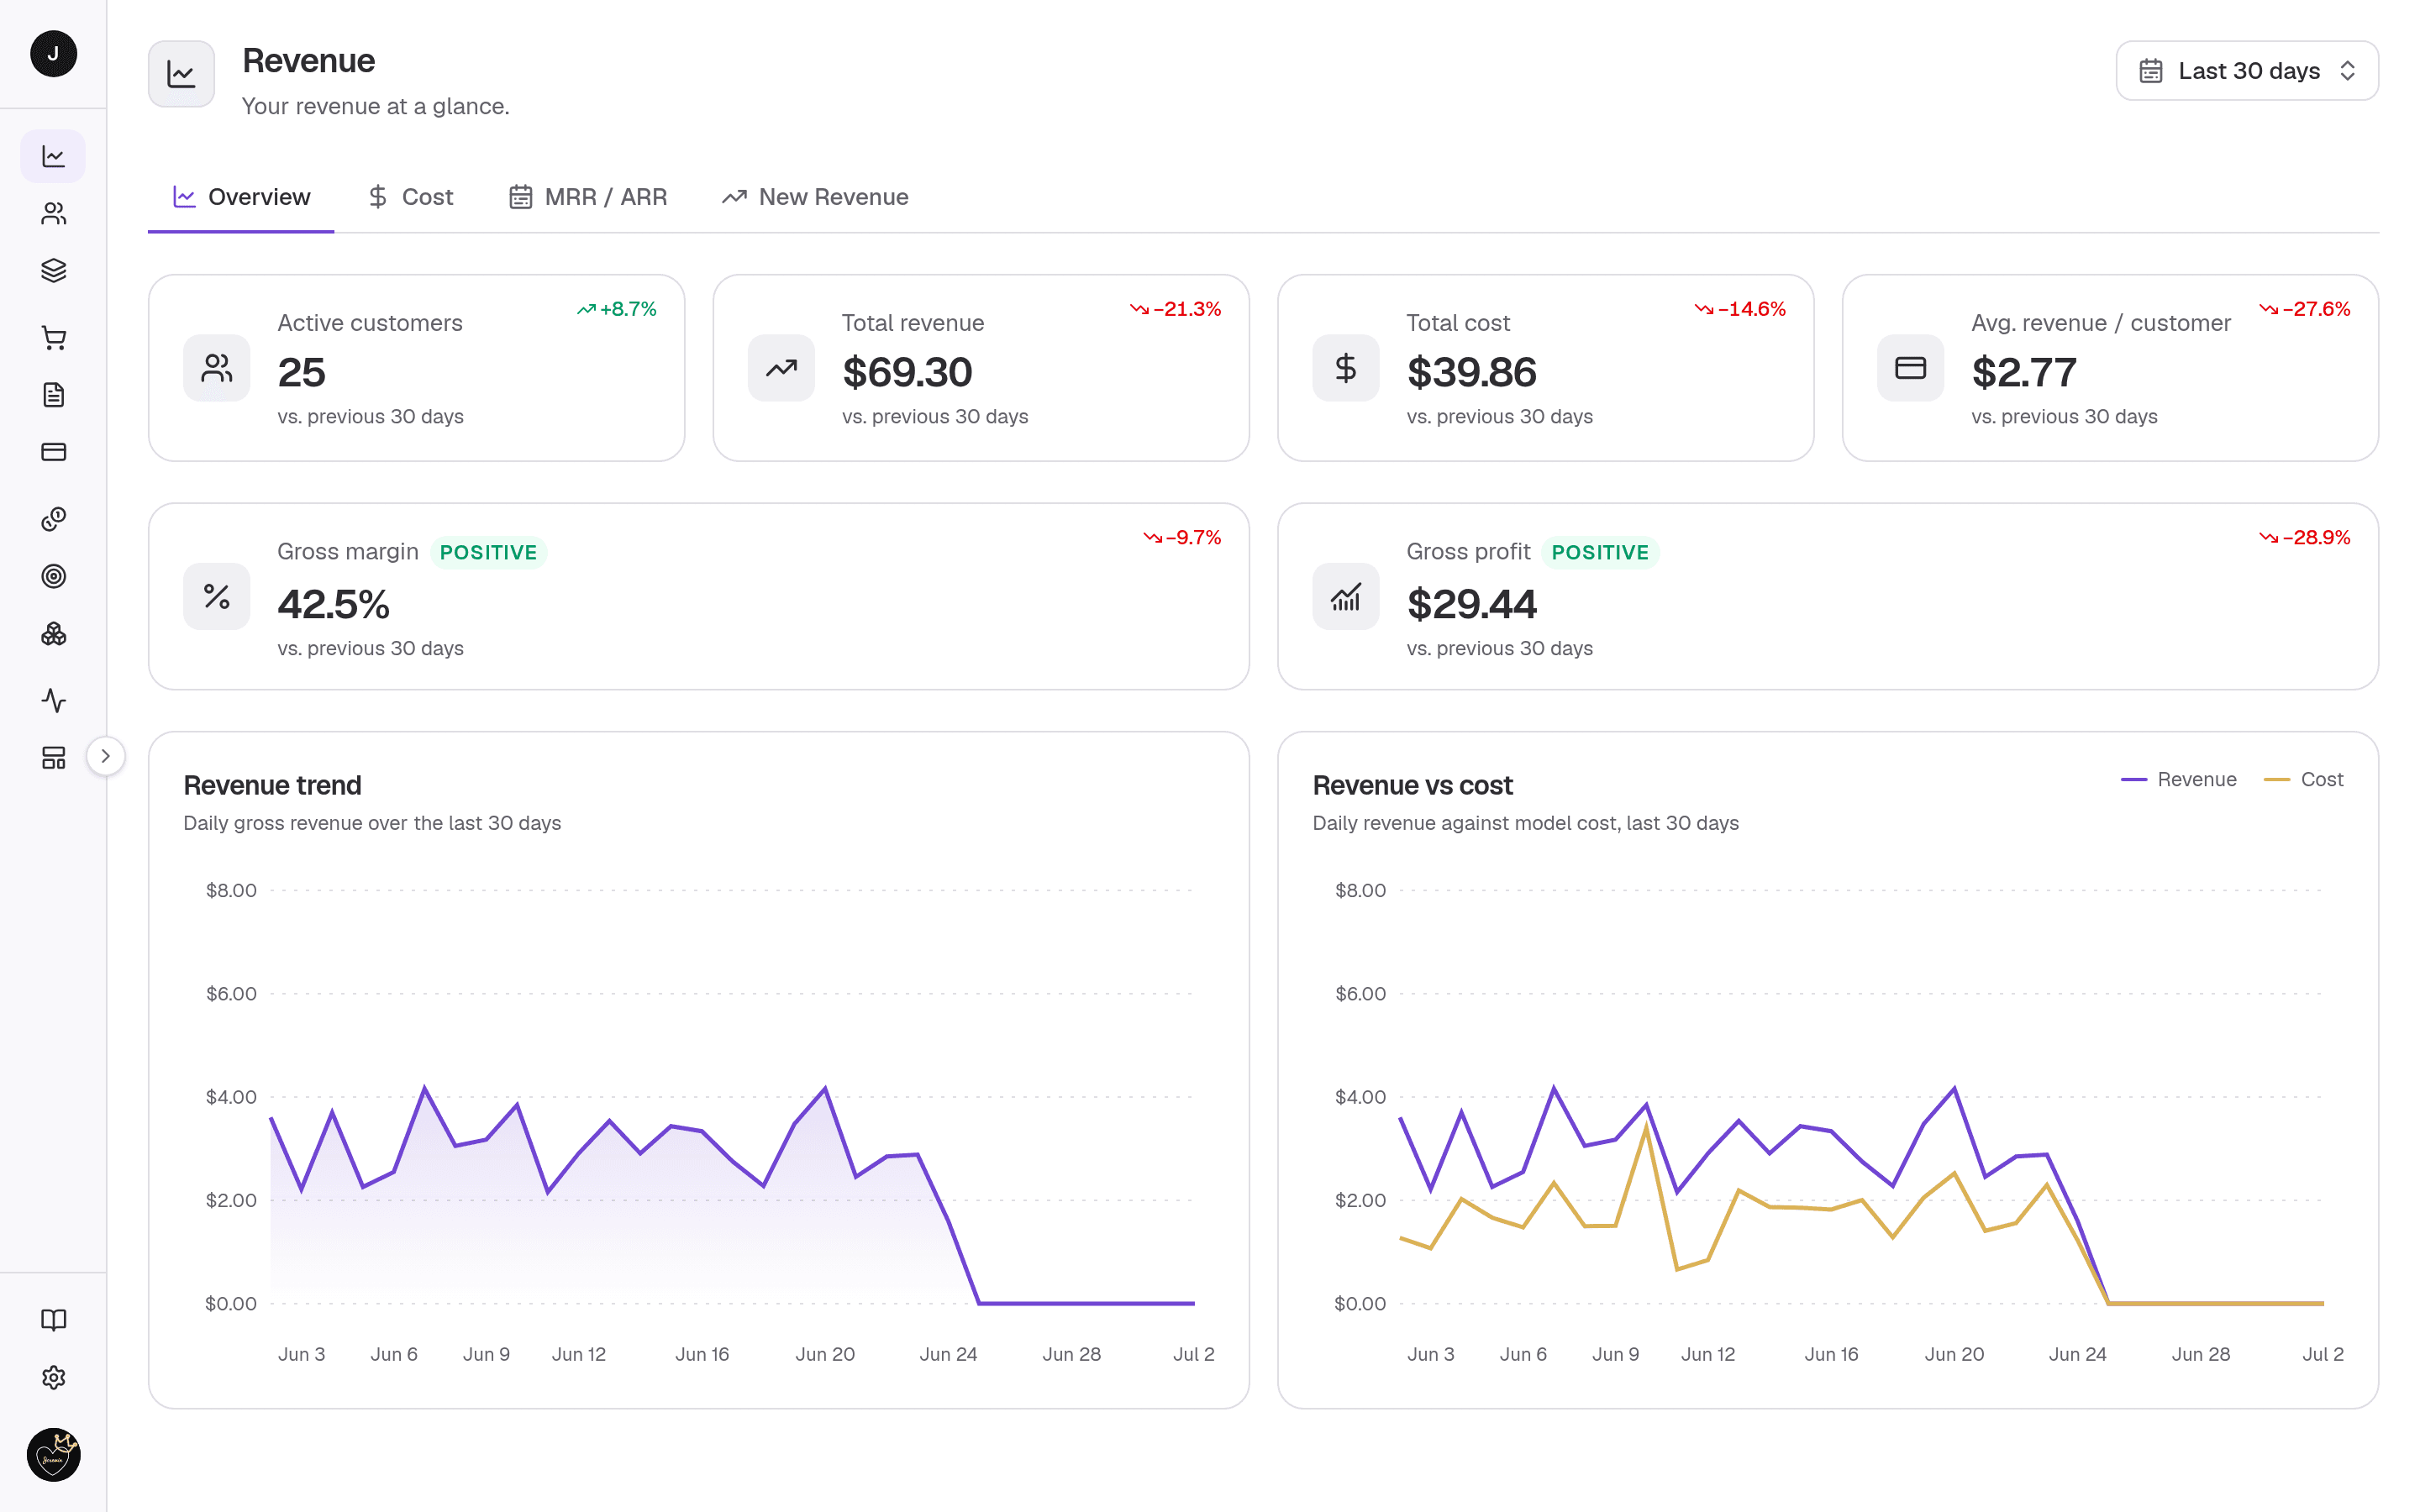
The Revenue dashboard is the app home — a read-only rollup of how your workspace is performing. It turns tracked usage and Customers into headline KPIs, trend charts, and ranked tables across four tabs. Every figure is scoped to your active Organisation, and Customer names throughout link to that Customer's detail page.
Date-range filter
Top-right of the header. Presets are This week, Last 30 days (the default), Last 3 months, and Last 6 months, plus Custom — an inline calendar with an All time shortcut and From/To picking. Trend charts rebucket to suit the window (daily, weekly, or monthly) and the delta hints update to match (e.g. vs. previous 30 days). Changing the range refetches in place; the previous numbers stay on screen until the new ones arrive.
The four tabs
- Overview — headline KPIs (Active customers, Total revenue, Total cost, Avg. revenue / customer), margin cards (Gross margin %, Gross profit $), a revenue-trend area chart, and a revenue-vs-cost dual-line chart.
- Cost — cost KPIs with per-customer averages, Top 5 highest / lowest cost tables (Cost, Profit, Margin), and Cost by model / Cost by provider pie charts.
- MRR / ARR — recurring-revenue KPIs, Revenue by month (last 12 months with a highlighted peak and a total footer), and Revenue by customer over the window.
- New Revenue — new-business KPIs (New customers, New revenue, MRR growth), a new-revenue trend chart, and a New customers table for the window.
Each KPI carries a period-over-period delta against the prior window, and the margin/average figures are flagged with Positive / Negative badges.
Revenue doesn't include tax
Tax you collect is owed to the government, so every revenue figure here leaves it out. A $118.00 payment that includes $18.00 GST counts as $100.00 of revenue. See Settings → Taxes.
No active organisation
Open the Dashboard without an active Organisation and it shows a "No active organisation" prompt with a link to sign in, rather than any figures.
Related
- Getting started — the setup that lands you here and sends the first Signal these metrics are built from.
- Signals — the tracked usage feed the rollups sum.
- Customers and Customer detail — the per-customer views the Dashboard links into.
- The API reference — record the usage Signals behind every figure.